imbalanced-learnを実際に使った分析例 使わない場合と比較
クリックでソースコード
##import
import pandas as pd
import numpy as np
from IPython.core.display import display
from copy import deepcopy as cp

##visualization
from ipywidgets import interact
from bokeh.plotting import figure
from bokeh.io import output_notebook, show, push_notebook
from bokeh.models import ColumnDataSource, Range1d
from bokeh.resources import INLINE
output_notebook(resources=INLINE)
import itertools

##import sklearn
from sklearn.model_selection import cross_val_score, StratifiedShuffleSplit, train_test_split
from sklearn.linear_model import LogisticRegression
from sklearn.metrics import confusion_matrix, precision_recall_curve, average_precision_score, classification_report
from sklearn.feature_selection import SelectKBest, f_classif, RFECV

##import imblearn
from imblearn.combine import SMOTEENN
from imblearn.over_sampling import SMOTE
from imblearn.pipeline import Pipeline

## statistical visualization
from string import ascii_letters
import seaborn as sns
import matplotlib.pyplot as plt
plt.rcParams['font.family'] = 'Kozuka Gothic Pro'
%matplotlib inline

def showPR(recalls, precisions, thresholds):
    ##make figure
    s1 = figure(
        title = "PR曲線",
        plot_width=300, plot_height=300,
        x_range=(-0.02,1.02), y_range=(0,1.02)
    )

    ##add line
    s1.line(
        recalls,
        precisions,
        line_width = 2
    )

    ##add patch
    s1.patch(
        np.hstack((recalls, 0, 1)),
        np.hstack((precisions, 0, 0)),
        alpha = 0.1,
    )

    s1.xaxis.axis_label = 'Recall'
    s1.yaxis.axis_label = 'Precision'


    show(s1)
はじめに
インバランスなデータ Credit Card Fraud Detection | Kaggle を用いて、imblearnを使ってみる。 imblearnで用いてる手法のアイデアは簡単にまとめた。
データの説明
このデータは、クレジットカードのデータから不正使用されたかどうか当てるタスクに用いることができる。ただしオリジナルデータは機密情報で会社としては公開できないので、このデータはオリジナルのデータをPCAしたものになる。説明変数は'Time'と'Amount'とV1とかV2とかで表される主成分である。Classが1であるサンプルが著しく少ないインバランスなデータである。
分析の流れ
- 可視化でどういう判別器を用いるか決定する。(線形判別できそうなのか否か)
- 変数選択をする(詳しくは前のブログ記事を見てください)
- imblearnでオーバーサンプリングとアンダーサンプリングを行う。
- インバランスを考慮しなかった場合と性能を比較する。
- 分析結果
3と4が本記事のメインディッシュです。
分析
1. どういう判別器を用いたら良いか。
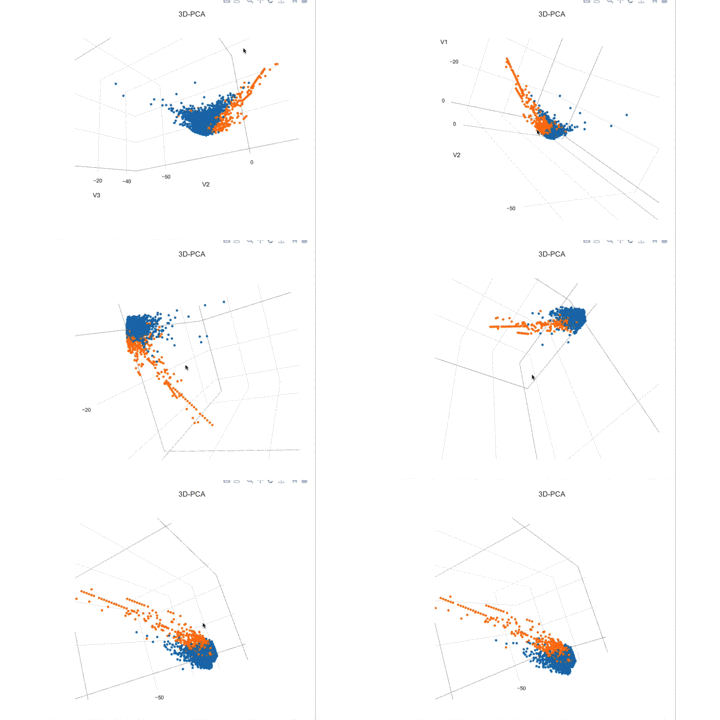
前の記事にも示したが、第三主成分まで見ただけでなんとなく線形分離できそうである。なので線形判別であるロジスティック回帰を適応することにする。

2. 変数選択をする。
分散分析の結果、有意だった上位5つと'Time'という特徴を分析に使うことにする。これを用いる経緯に関しては、過去の記事の" sklearn.feature_selection.SelectKBestによる選択"を見て欲しい。
##acquire data
df = pd.read_csv('./creditcard.csv')
##make matrix
X = df.drop('Class', axis=1)
y = df.Class

##select features
select = SelectKBest(k=5)
select.fit(X, y)
mask = select.get_support()
X_selected = pd.concat([df.Time, X.iloc[:,mask]], axis=1)
pd.concat([X_selected.head(), y.head()], axis=1) ##確認用
print('Xの形',X_selected.shape,'\t異常の数', y[y==1].count(),'\t正常の数', y[y==0].count())
Xの形 (284807, 6) 異常の数 492 正常の数 284315
3. imblearnでオーバーサンプリングとアンダーサンプリングを行う。
SMOTEENNを行ってみる。その結果、正常と異常の数がどう変化するか見てみる。
print('Xの形',X_selected.shape,'\t異常の数', y[y==1].count(),'\t正常の数', y[y==0].count())
X_smoteenn, y_smoteenn=SMOTEENN(ratio='minority',
                                random_state=16,
                                smote=SMOTE(n_jobs=3, random_state=16)
                               ).fit_sample(X_selected, y)
X_smoteenn, y_smoteenn = pd.DataFrame(X_smoteenn), pd.Series(y_smoteenn)
print('Xの形',X_smoteenn.shape,'\t異常の数', y_smoteenn[y_smoteenn==1].count(),'\t正常の数', y_smoteenn[y_smoteenn==0].count())
    Xの形 (284807, 6)  異常の数 492    正常の数 284315
    Xの形 (541315, 6)     異常の数 269833     正常の数 271482
圧倒的に多かった正常の数が13000点ほど減り、圧倒的に少なかった異常の数が正常の数と同程度まで水増しされている。もし比率を変更したいなら、以下のようにすれば良い
print('Xの形',X_selected.shape,'\t異常の数', y[y==1].count(),'\t正常の数', y[y==0].count())
X_smoteenn, y_smoteenn=SMOTEENN(ratio={1: 10000}, #y=1に対して10000個に増やすように指定
                                ##なぜかここで指定した半分程度しか異常が増えてくれないが…増やした後にENNによって結構取り除かれてしまっていると思われる
                                random_state=16,
                               ).fit_sample(X_selected, y)
X_smoteenn, y_smoteenn = pd.DataFrame(X_smoteenn), pd.Series(y_smoteenn)
print('Xの形',X_smoteenn.shape,'\t異常の数', y_smoteenn[y_smoteenn==1].count(),'\t正常の数', y_smoteenn[y_smoteenn==0].count())
    Xの形 (284807, 6)  異常の数 492    正常の数 284315
    Xの形 (288441, 6)     異常の数 5532   正常の数 282909
4. インバランスを考慮しなかった場合と性能を比較する。
オーバーサンプリングとアンダーサンプリングをしなかった場合と比較したいので、こちらの判別を先に行う。過去の記事でクロスバリデーションをした際、単純に層化K分割交差検証を行ったが今回は、層化シャッフル交差検証に変更した。その結果大きくスコアが下がる結果になったのでもしかしたらサンプルの並び順になんかしらの情報が入ってしまっていたのかも知れない
split = StratifiedShuffleSplit(n_splits=10, test_size=0.1, train_size=0.9, random_state=4)
pr_auc = cross_val_score(LogisticRegression(), X_selected, y, scoring="average_precision", cv=split)
print('10-foldCVの平均のPR_AUC: {:.4f}'.format(np.mean(pr_auc)))
print('詳細: ',pr_auc)
10-foldCVの平均のPR_AUC: 0.4660
詳細:  [ 0.46817098  0.40416226  0.54907801  0.49439502  0.47769519  0.40379713
  0.42626342  0.52400262  0.49699492  0.41532673]
インバランスを考慮しなかったときは、PR曲線の下の面積が0.4660というあまり性能の良くないものになった。次にSMOTE+ENNをかけたときを見てみましょう。SMOTE+Tomekではないのかというと、公式ドキュメントの図と今回のデータを見比べた所、ENNで除去したほうが判別境界がはっきりと分かれそうだと判断したからである。
pipe = Pipeline([('sm', SMOTEENN(ratio='minority',
                                 random_state=16,
                                )),
                 ('lr', LogisticRegression())])
pr_auc = cross_val_score(pipe, X_selected, y, scoring="average_precision", cv=split)
print('10-foldCVの平均のPR_AUC: {:.4f}'.format(np.mean(pr_auc)))
print('詳細: ',pr_auc)
10-foldCVの平均のPR_AUC: 0.7343
詳細:  [ 0.67942206  0.67656725  0.77471922  0.69251982  0.82281877  0.65851618
  0.71672565  0.77464123  0.8028783   0.74382949]
インバランスを考慮すると、PR曲線の下の面積が0.7343と大きく増えた。豆知識的な話だが、imblearnはsklearn同様、Pipelineを実装している。交差検証を行う際はこれを使うとよいだろう。今回はこれを用いた。sklearnのPipelineとは別物なので、
from imblearn.pipeline import Pipeline
でインポートしよう。smote等を用いた後にsklearnのPipelineで交差検証するのはいけない。分割してから訓練データにSMOTE等をかけなければいけないからである。元のデータにSMOTEをかけてから分割すると、水増ししたデータをテストに使うことになってしまう。これはまずい。アンダーサンプリング、オーバーサンプリングも交差検証のループの内側で行う必要がある。imlearnのPipelineならばこれを簡単に行うことができる。
最後に、PR曲線でも描いて両者を比較しましょう
X_train, X_test, y_train, y_test = train_test_split(X_selected, y, random_state=256)
prob = LogisticRegression().fit(X_train, y_train).predict_proba(X_test)
precision, recall, thresholds = precision_recall_curve(y_test, prob[:,1], pos_label=1)
showPR(recall, precision, thresholds)

X_train, X_test, y_train, y_test = train_test_split(X_selected, y, random_state=256)
X_smoteenn, y_smoteenn=SMOTEENN(ratio='minority',
                                random_state=16,
                                smote=SMOTE(n_jobs=3, random_state=16)
                               ).fit_sample(X_selected, y)
prob = LogisticRegression().fit(X_smoteenn, y_smoteenn).predict_proba(X_test)
precision, recall, thresholds = precision_recall_curve(y_test, prob[:,1], pos_label=1)
showPR(recall, precision, thresholds)

SMOTEENNを適応した方が改善されることが一目瞭然だ。特にPrecisionとRecallはThreshold(0,1に切るための確率の値)を動かしたときにトレードオフの関係にあるのだが、それが大きく改善されている。
インバランスを考慮しなかったほうでは、precisionが0.8あっても、Recallが0.5しか達成できないモデルだったが、インバランスを考慮すると、precisionが0.8、recallが0.7あるモデルが得られた。
5. 分析結果
インバランスを考慮した方が良い性能が出ることを確認したところでこのモデルを採用して、最後に判別をするための閾値を決定する。
precision_recall_report = pd.DataFrame({
    'precision':precision[:-1],
    'recall':recall[:-1],
    'threshold':thresholds})
precision_recall_report[(precision_recall_report.precision > 0.8 )&(precision_recall_report.recall > 0.7)]
| precision | recall | threshold | |
|---|---|---|---|
| 65228 | 0.801980 | 0.729730 | 0.935115 |
| 65230 | 0.808081 | 0.720721 | 0.952659 |
| 65231 | 0.806122 | 0.711712 | 0.968478 |
| 65232 | 0.814433 | 0.711712 | 0.975557 |
| 65233 | 0.822917 | 0.711712 | 0.979050 |
| 65234 | 0.821053 | 0.702703 | 0.981939 |
この表を使って良さそうな閾値を探すと、0.97程度(めちゃくちゃ大きいが…)が良さそう。これを使って判別してみると、以下のようになった。
predictor = LogisticRegression().fit(X_smoteenn, y_smoteenn)
pred_097 = predictor.predict_proba(X_test)[:,1] > 0.97
print(classification_report(y_test, pred_097,target_names=['正常','不正']))
print('    TN\t FP\n    FN\t TP\n',confusion_matrix(y_test, pred_097))
             precision    recall  f1-score   support

         正常       1.00      1.00      1.00     71091
         不正       0.81      0.71      0.76       111

avg / total       1.00      1.00      1.00     71202

    TN   FP
    FN   TP
 [[71073    18]
 [   32    79]]
もっとRecallとf1が欲しいところだが、今回はあくまで、imblearnを使ってモデルの改善をすることに重きを置くため、これを最終結果として今回の分析はおしまい。(前処理とかもしてないしね)